
Bacterial Growth Data
Factors Affecting Growth
Microbial growth is only possible when all essential nutrients are provided and chemical and environmental conditions are met. Yet, there is a range of conditions that a species can live in. Therefore, their growth will be influenced by these factors. For instance, the temperature, pH, and oxygen level are some of the environmental factors that will affect their growth. On the other hand, the presence and availability of certain nutrients like carbon, nitrogen, and sulfur, will also influence their growth, as well as the competition for nutrients with other microorganisms if present.
Temperature
As in a chemical reaction, microorganisms have a minimum, optimal, and maximum temperature when growing. As expected, growth will be maximal at an optimal temperature, and on the contrary growth will stop beyond the minimal and maximal temperatures. These values vary depending on the microbial species. In the specific case of bacteria, they can be classified into three groups: mesophiles, for bacteria able to grow at medium temperatures (usually between 25°C and 40°C), psychrophiles, for bacteria able to grow at low temperatures (usually between 0°C and 20°C), and thermophiles, for bacteria able to grow at high temperatures (usually between 50°C and 60°C).
pH
pH affects the synthesis and structure of fundamental macromolecules for growth like DNA, proteins, and lipids. Thus, the acidity or basicity of the environment described by the pH also affects microbial growth. There are three main classifications in the case of bacteria according to their pH preferences: neutrophiles (grow at neutral pH), acidophiles (grow at very acidic pH: < 5.5), and alkaliphiles (growth at very alkaline pH: > 8.5).
Oxygen Level
Aerobic species will only grow in the presence of oxygen; they obtain energy through aerobic respiration and use oxygen as the terminal electron acceptor. On the other hand, obligate anaerobic species will only grow when oxygen is not present; they obtain energy through fermentation and use organic or inorganic compounds as a terminal electron acceptor. Moreover, facultative anaerobic species will grow with or without oxygen.
Carbon, Nitrogen, Sulfur and Phosphorus Sources
For microorganisms to be able to duplicate, they have to synthesize new cell components and macromolecules. Carbon, nitrogen, sulfur, and phosphorus sources are fundamental, they provide the chemical elements that are necessary for building cellular structures and support metabolic pathways. How microbes obtain these nutrients varies between species. For example, in the case of bacteria, they can obtain carbon from organic sources (chemoheterotrophs) or carbon dioxide (chemoautotrophs and photoautotrophs), nitrogen can be obtained from proteins or the atmosphere (nitrogen-fixing bacteria), sulfur can be obtained from proteins, sulfates, and hydrogen sulfide and phosphorus can be obtained from inorganic phosphate salts or buffers.
All of the environmental factors explained above will be important when setting up the right laboratory conditions that allow microbial growth under in vitro conditions.
Methods of Culture
In general, the methods of culture and experimental set-ups differ depending on the objective of the specific experiment but as a general rule, all types of cultures should be mixed, homogenized, and in equilibrium with the gas phase. However, cultivating microorganisms in the laboratory is a much more difficult task given the difficulty to provide all the nutrients and environmental conditions needed to grow. This often makes cultivation challenging, time-consuming, and labor-intensive. There are mainly three culture or fermentation techniques widely used to grow microbial populations in vitro: batch, fed-batch, and continuous fermentation.
Batch Fermentation
A batch fermentation is a closed-culture system, this means that it contains a fixed volume of nutrients or substrates in the medium. After the microbial cells are inoculated into the culture medium, they will grow until all the nutrients are depleted. At the same time that nutrients are consumed, metabolic byproducts and waste materials will accumulate in the culture flask. As mentioned before, some microbial organisms like bacteria cultivated in a batch reactor usually follow the four phases of growth described above: lag, exponential, stationary, and decline phase.
Fed-batch Fermentation
A fed-batch fermentation is considered a modification from the common batch culture. Initially, the fed-batch fermentation operates in the same way as the batch fermentation until the culture reaches the end of the exponential phase. To extend the exponential phase, the reactor will be supplemented with a controlled feeding of nutrients, this feeding will extend the log phase resulting in an increased growth . As in the case of batch fermentation, byproducts will accumulate.
Continuous Fermentation
A continuous fermentation is characterized by the constant addition of new nutrients to the system while at the same time, the old culture broth is removed. The vessel used to grow a continuous culture is called a chemostat. In a chemostat, nutrients are continuously refreshed, while medium waste products and cells are continuously removed at the same time, resulting in wash-out if species do not divide fast enough. Because the influx and outflow rates are constant, the volume in a continuous culture is constant as well. The maximum working volume of the vessel will not limit the influx of new medium entering as in the case of the fed-batch fermentation. The influx of substrates and flow rate in a chemostat can be used to control the growth rate and the number of cells as well as expanding the exponential phase. Given that in a chemostat there is a constant influx and outflow of medium, a steady state (no increase or decrease in the number of cells) will be achieved when the growth rate is equal to the flow rate.
Quantification of Microbial Cultures
Quantifying the number of cells over a period of time allows a better understanding of how the specific population grows, reaches a maximum density, and declines. This also allows to calculate the growth rate and with it gain insights about the growth kinetics. This information is important to understand how microorganisms behave for different pH and temperature values, or nutrients available. In co-cultures, more than one microbial strain is cultivated in the same medium simultaneously. This allows us to study mutualistic and antagonistic interactions between these strains, as well as their dynamics. Quantification is crucial not only to assess microbial growth but also to prepare the inoculum samples. Different techniques have been developed to quantify microbial cells in a sample. All of these quantify cells in different units (Table below) and have different characteristics as discussed below.
| Measurement techniques | Units |
|---|---|
| Direct Microscopic Count | Cells per volume (e.g., cells/mL, cells/cm³) |
| Colony Forming Units (CFU) | CFU/mL (liquid samples), CFU/g (solid samples) |
| Optical Density (OD) | OD is dimensionless |
| Flow Cytometry (FC) | cells/mL |
| 16S rRNA Seq | Normalized read counts |
Direct Microscopic Count
This technique involves counting directly the number of cells by placing a small volume of the sample of interest into a hemocytometer. This instrument consists of a thick glass microscope slide with a rectangular grid that facilitates the counting, depending on the cell size different grids can be used. Using this method provides an easy, low-cost way to count cells without the need for incubation. On the other hand, it can be susceptible to human errors given the difficulties of counting under a microscope.
Colony Forming Units (CFU)
The Colony Forming Units (CFU) are a direct measurement of the number of viable cells in a sample. The method consists of diluting the sample of interest a given number of times, usually in a 1:10 ratio. This procedure is known as serial dilution and it helps to better count the number of CFUs in the sample. After each dilution, the diluted samples will be placed and incubated in different agar plates to allow the colonies to grow. Once the incubation time finishes the number of colonies present in the agar plate is counted and the number of cells is calculated depending on the specific dilution factor and volume of the original sample.
Optical Density (OD)
To avoid counting CFUs, another technique used to quantify growth is to measure the cell's density by using a spectrophotometer. When a microbial culture is placed in a cuvette and a beam of light passes through it, the light beam will be scattered by the bacterial cells. How the beam scatters depends directly on the cell density and at the same time the cell density is proportional to the number of cells. If in a sample the number of microorganisms increases, so does the cell density and this is reflected in the turbidity of the sample, which is also known as optical density (OD). In this way, a spectrophotometer is used to measure the absorbance of light by the bacterial sample at a specific wavelength. Using the resulting OD values to calculate the cell concentration is only possible if a calibration curve (OD values versus known cell concentrations) is available. In practice, the reading will highly depend on the wavelength used, how the light interacts with the sample (e.g. direct, reflected, etc.), the microbial strain, and if there is any light absorption by the medium instead of the cells. Although this method provides an indirect growth measurement, it is one of the most common techniques given its simplicity and speed.
Flow Cytometry (FC)
By using a flow cytometer different physical and chemical properties can be accurately measured in individual cells. The sample of interest is injected into a buffered saline solution also known as sheath fluid allowing the sample to run through the flow cytometer in a laminar flow. Each of the cells in the fluid sample passes by a beam of laser light and scatters light, which is collected by photodetectors. If the cell carries fluorophores, they can be excited by the laser light and emit light that is also collected. The scattered light is measured from two different angles: Forward Scatter (FSC) which is proportional to the cell size and Side Scatter (SSC) which relates to the cell's internal complexity
16S rRNA gene sequencing
The 16S ribosomal RNA (rRNA) gene is a highly conserved region within the prokaryotic genome that contains nine hypervariable regions (V1–V9) interspersed between highly conserved ones. These variable regions within the 16S rRNA gene provide considerable sequence diversity among different microbial taxa and in this way provide phylogenetic information and allow the classification of microbial taxa. The resulting sequences represent the relative abundances of taxa in microbial communities that were present in the original sample. After preprocessing the sequence reads, these are grouped with a certain level of divergence (usually around 97% identical) and form Operational Taxonomic Units (OTUs). The final result usually will be a count table, from which relative abundances can be obtained. Although 16S rRNA gene sequencing does not produce a direct count of the number of microbial cells in a sample it is of high relevance for the study of microbial communities. The quantification of the relative abundances of different taxa at once allows the analysis of the distribution of microbes and provides information about the structure and dynamics of microbial communities.
Our Database
µGrowthDB
µGrowthDB is a relational database written in MySQL. It contains 12 tables: project, study, experiment, biological replicate, biological replicate metadata, metabolite, metabolite per biological replicate, compartment, community, community member, taxa and perturbation. The definition of the tables that are most important to understand how the microbial growth database is structured are provided below.
| Term | Definition |
|---|---|
| Project | A project represents a distinct research endeavor focused on microbial growth. It serves as the overarching container for organizing related studies and experiments. The user will need to specify the corresponding project for the study described in this template at the time of submitting the document to the database. |
| Study | A study conducted within the framework of a project refers to a focused investigation aimed at exploring a specific aspect of microbial growth. Each study is carefully designed to address particular research questions or hypotheses and may involve multiple experiments. In case of well plates, a study should represent a single plate. |
| Experiment | An experiment represents a unique set of experimental conditions or treatments applied to a set/group of biological replicates. Control cases should be considered as distinct experiments. |
| Biological Replicate | A biological replicate is a distinct sample/measurement within an experiment. Data regarding growth and/or metabolite levels should be provided for the available time points and for every biological replicate. |
| Compartment | A compartment is a distinct section or partition within the growth environment (or “vessel”) where biological samples are grown under specific environmental conditions. Each compartment corresponds to a different set of environmental parameters (e.g., temperature, pH, medium etc.) tailored to the requirements of the experiment. An experiment needs to have at least one compartment. |
| Community | Consists of one or more members. Each experiment needs to have at least one community, unless it consists of a control without any microbial community. |
| Community Member | A microbial strain present in at least one experiment. |
| Perturbation | Refers to a deliberate disturbance or alteration applied to a specific experiment. It may refer to a perturbation in the environmental conditions described in the corresponding compartment and/or changes to the community (e.g., introducing new strains). |
Given that µGrowthDB is a relational database, each table contains foreign keys to establish the different relationships between the tables. For example, a project within the database contains a study. This relationship is created thanks to the projectId, which is a foreign key that uniquely identifies a project (Project table row) to a study (Study table row).
How to Upload My Data?
To upload your data in µGrowthDB please follow the five steps provided in the Upload data page. Once you download the corresponding Excel templates for your study, you must complete these following the instructions provided within the README sheet. A detailed explanation step by step explanation on how to complete these templates is provided below.
Complete the data template:
1. Identify the number of experiment study
What is an experiment?
An experiment represents a unique set of experimental conditions or treatments applied to a set/group of biological replicates. Control cases should be considered as distinct experiments.
2. Identify the number of biological replicates in your experiment
What is a biological replicate?
A biological replicate is a distinct sample/measurement within an experiment. Data regarding growth and/or metabolite levels should be provided for the available time points and for every biological replicate. Note: positive or negative controls are considered also as a separate experiment.
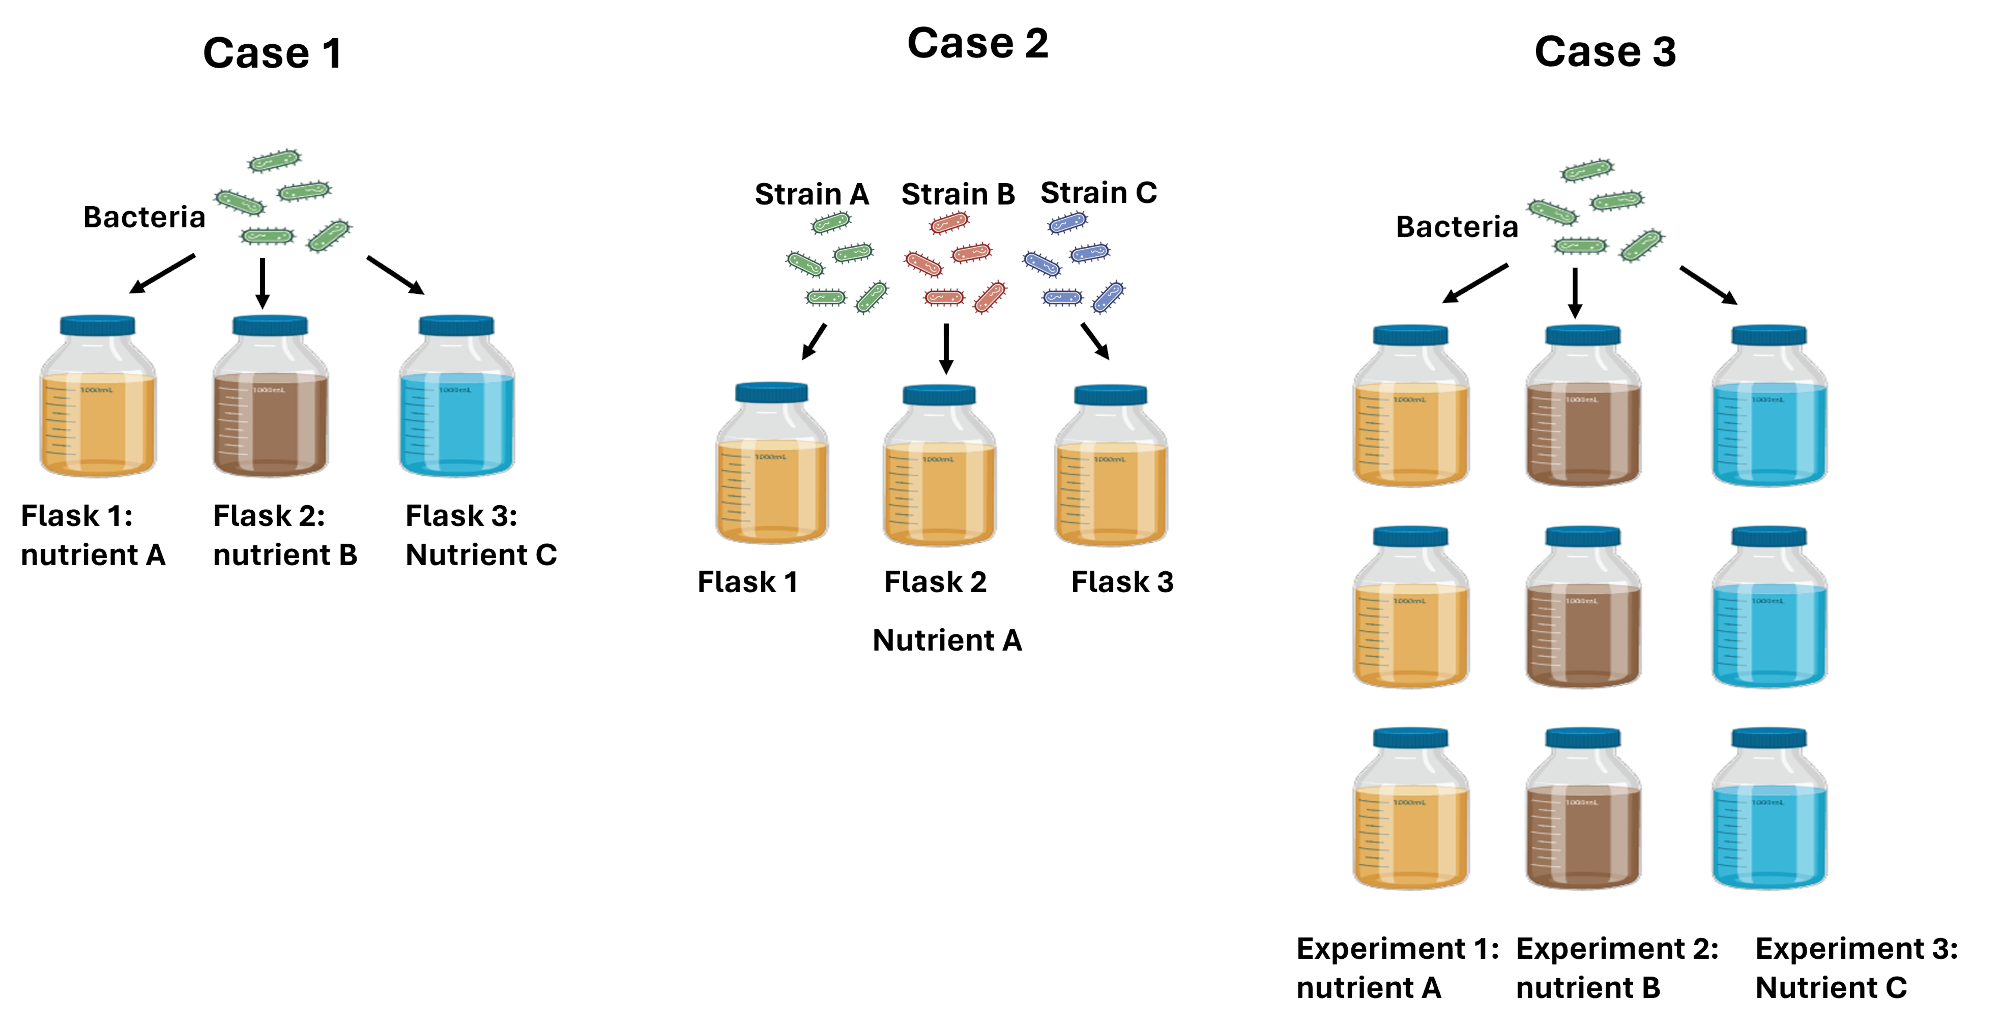
Cases:
-
You're studying how bacteria grow in different nutrient environments, you set up 3 separate flasks, each containing the same culture of bacteria in a different nutrient solution. Each flask represents a different experiment with only one biological replicate for each of them. Total number of biological replicates per experiment: 1.
-
You're studying how 3 bacterial strains grow in a nutrient environment, you set up 3 separate flasks, each containing a culture of one of the strains in the same nutrient solution. Each flask represents a separate experiment. Total number of biological replicates per experiment: 1.
-
You're studying how bacteria grow in different tree different nutrient environments, you set up 3 separate flasks for each of them containing the same culture of bacteria. Total number of biological replicates per experiment: 3.
3. Identify the number of technical replicates per biological replicate:
What is a technical replicate?
Technical replicates are repeated measurements of the same sample that demonstrate the variability of the protocol. Technical replicates are important because they address the reproducibility of the assay or technique. In case of having technical replicates please report the average and standard deviation per time-point measured in the corresponding data template.
4. Let's complete the data template:
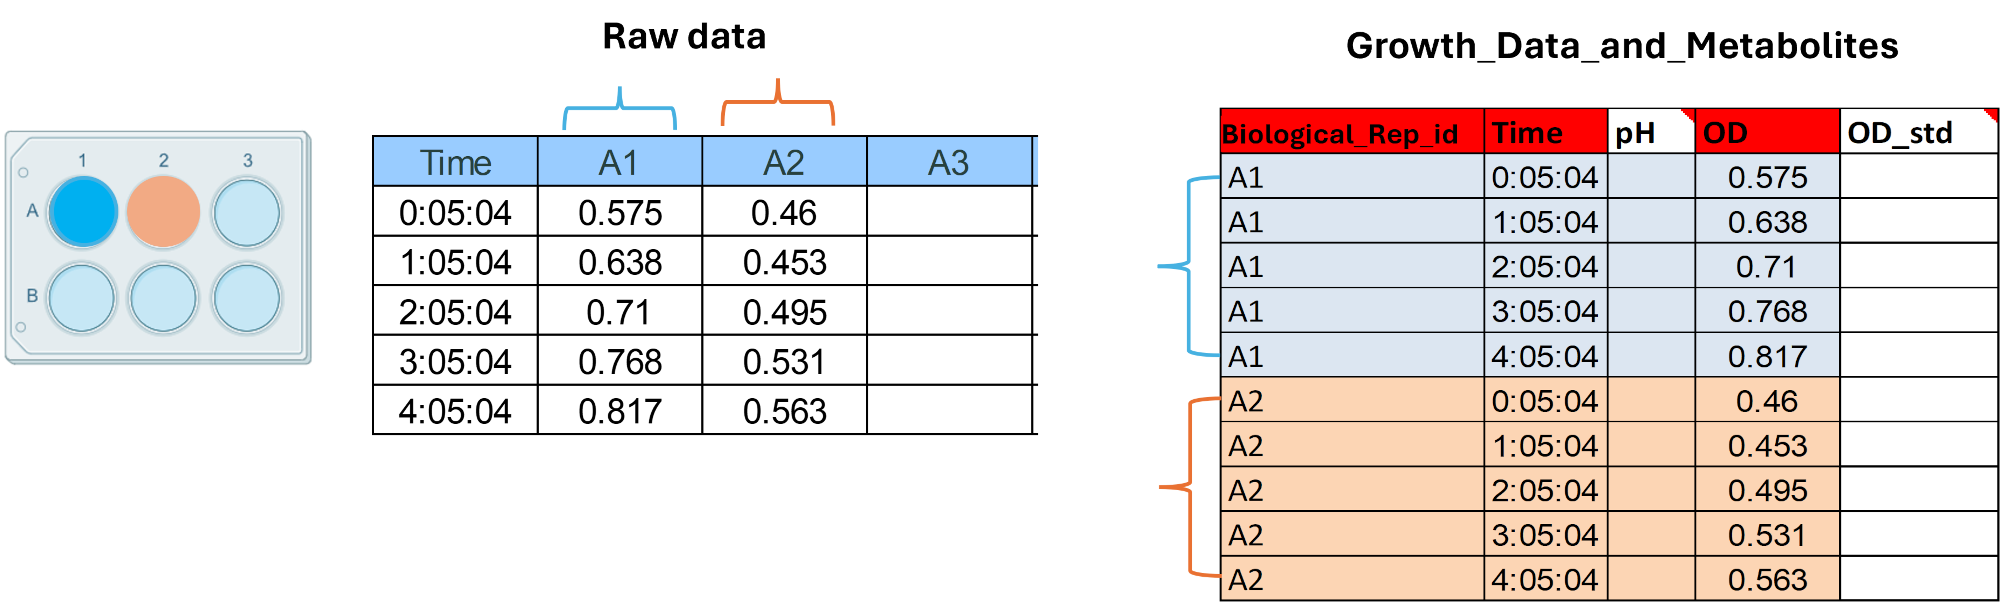
Growth_Data_Metabolites
In this sheet you will have to complete only the measurements related to the following techniques: OD, Plate-counts, Flow Cytometry total cell counts, metabolite concentrations. Whether you used a micro-plate, a cuvette, a bottle or a mini bioreactor, each individual vessel (cuvette, well or bottle) will represent a unique Biological_Replicate_id. Let's assume you used a micro-plate to measure OD in only 2 wells (positions A1 and A2). Your raw data could look like in the image below. Let's complete our template using this toy example. In this case we will have 2 biological replicate ids (A1 and A2) you can choose any alphanumerical option as long as is unique and informative to you. Then each row will represent a time-point measurement per replicate id. In this case only one measurement per well was taken, this indicates that the number of technical replicates is 1. In case you took more than one measure per well the OD_std must be completed too. The same applies for all the other methods.
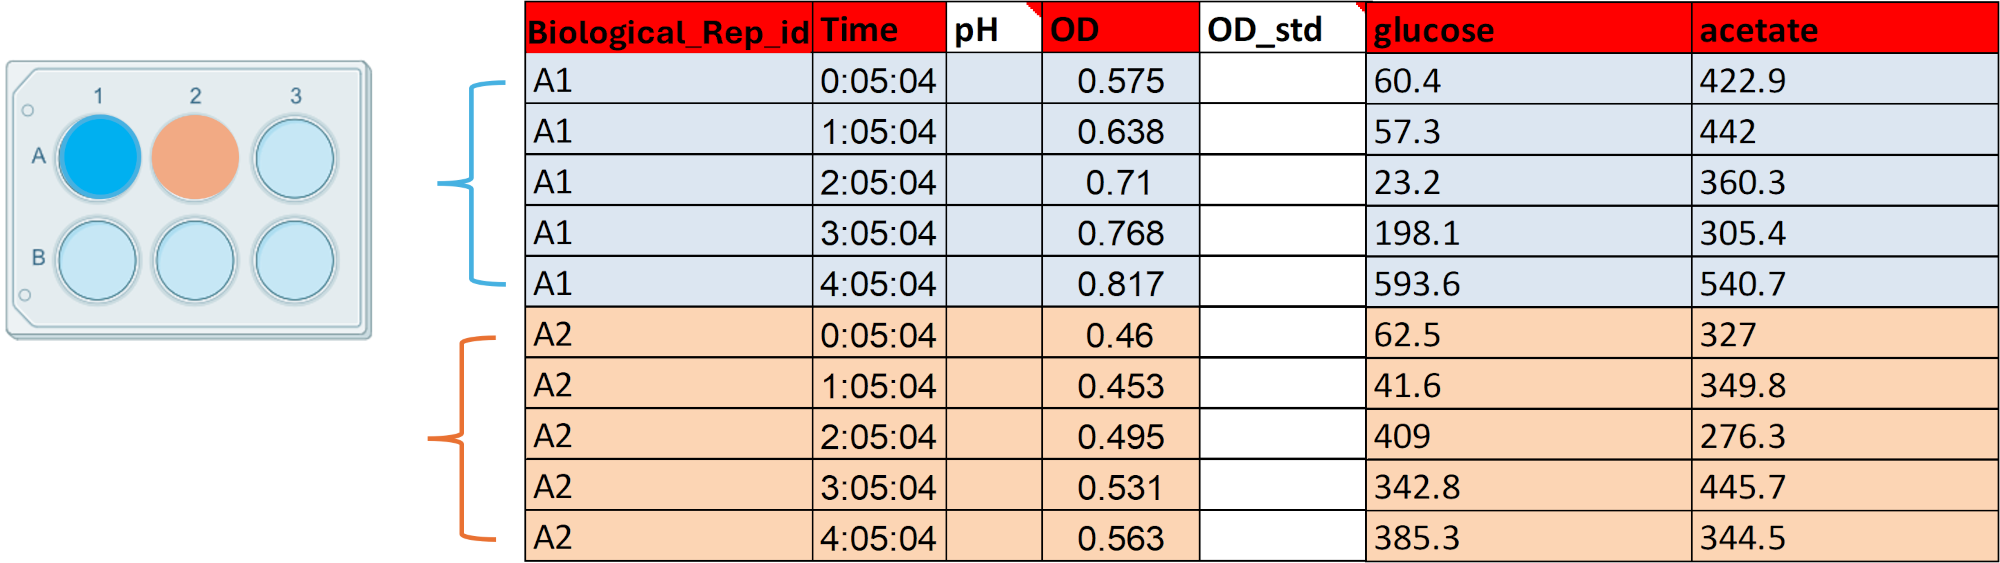
Growth_Data_Metabolites: Metabolite concentrations
If in your data, you also measure the concentration of different metabolites per vessel (cuvette, well or tube), complete each column associated with each metabolite, every row will be associated with a time-point and a biological replicate id.
Let's assume that for each of the previous well-plates (A1 and A2) you measured also the concentration of glucose and acetate. Transform your raw data if necessary so it matches the Biological_Replicate_id column. Fill the concentration values for each time-point and replicate_id (e.g. A1 and A2) in each of the metabolite columns.
Complete our template using the last toy example. For every Biological_Replicate_id we will complete the concentration values of glucose and acetate for each time-point.
Growth_per_Species:
If in your data, you also measure abundances of more than one bacterial species (by Flow Cytometry or 16S rRNA gene sequencing), your data template will have another sheet (Growth_per_Species). In a similar way than in the other sheet, complete each row with the corresponding Biological_replicate_id, Time and the values of per species.
Complete the study template:
The study template corresponds to the metadata of the study and
are directly related to the tables of the database. This Excel
file contains eight sheets: